All tutorials
How to plot a file of 3 word addresses in ArcGIS Online
This tutorial will take you through the steps required to add a CSV file containing 3 word addresses and other attributes to ArcGIS Online using Map Viewer Classic so that the 3 word addresses are plotted as a point layer on the map.
First, a CSV file is created. Next, this is added as a layer and styled ready for further analysis or for publishing to other users.
Follow this tutorial or watch this video to set up the what3words ArcGIS Locator within ArcGIS Online and add it as a Utility Service.
Getting started with Dazi, GIS Technical Account Manager at what3words:
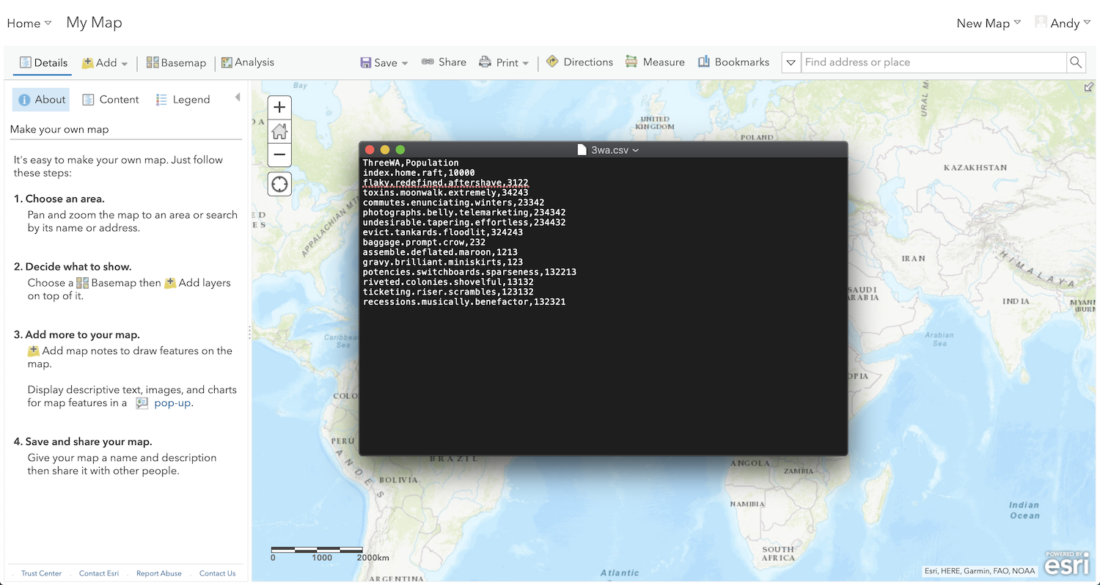
Create a CSV file with a column of 3 word addresses and fields of other data that can be displayed alongside the 3 word address. This can be done in Excel or a text editor. Here is an example file.
Drag and drop the file from its folder in Windows Explorer/Finder onto the map in ArcGIS Online.
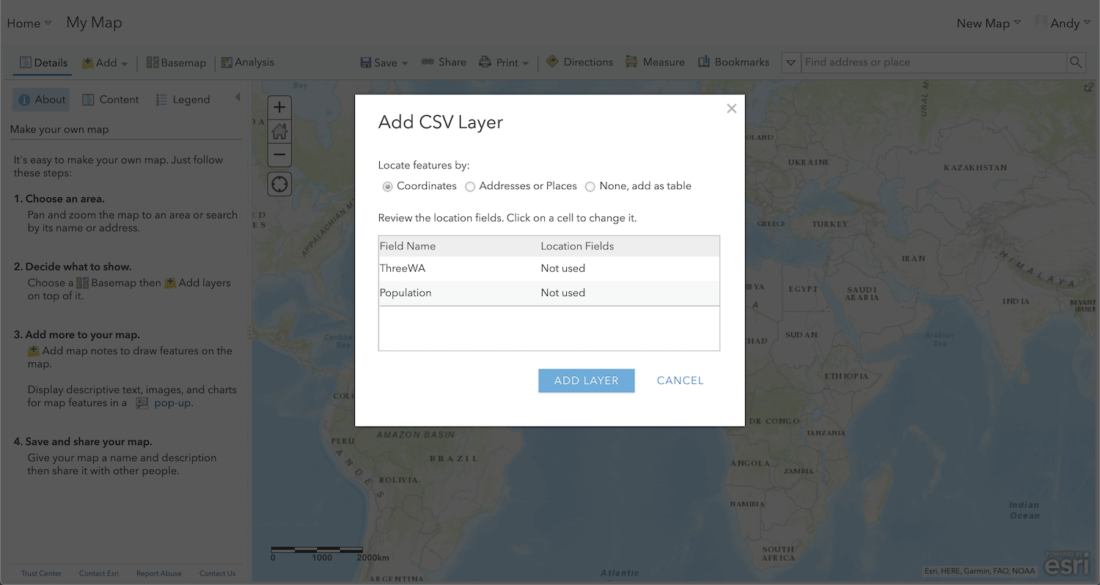
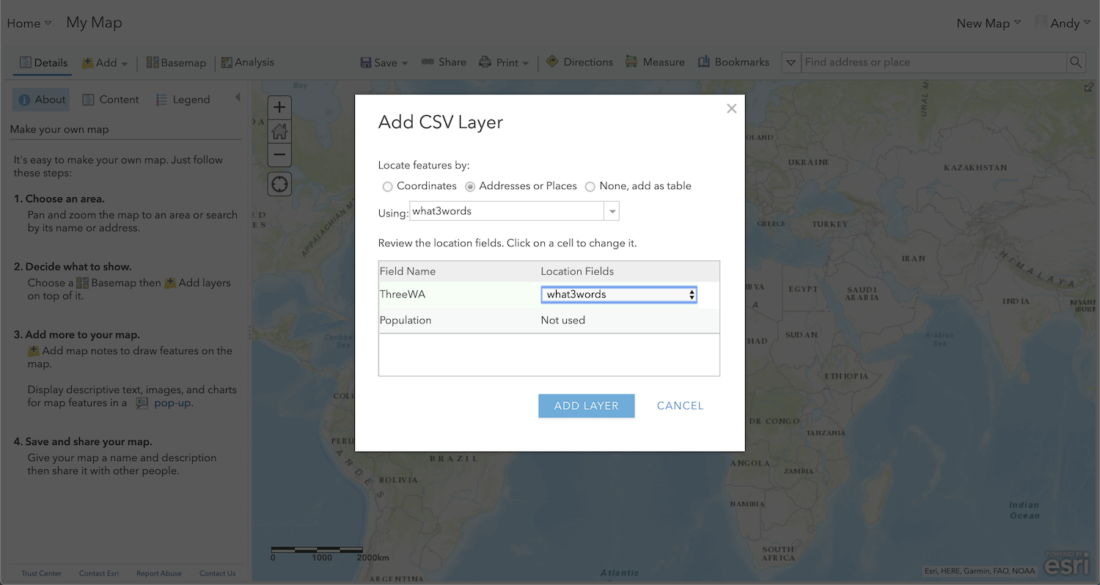
Select to locate features by “Addresses or Places”. Select using the what3words locator. In the field list, you will then need to select the field containing the 3 word addresses and select the what3words locator against this field. Click “ADD LAYER”.
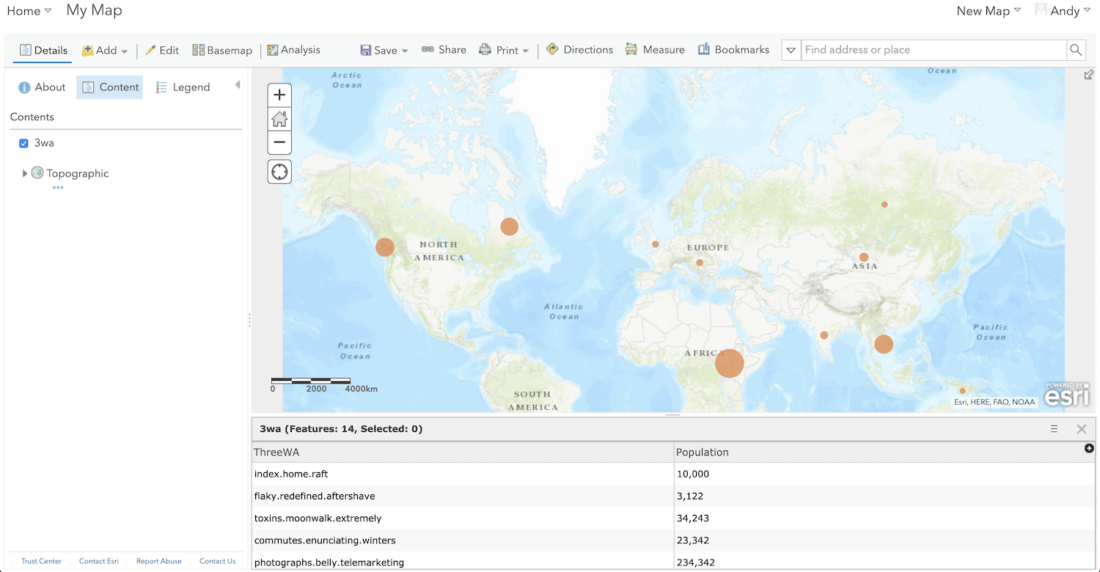
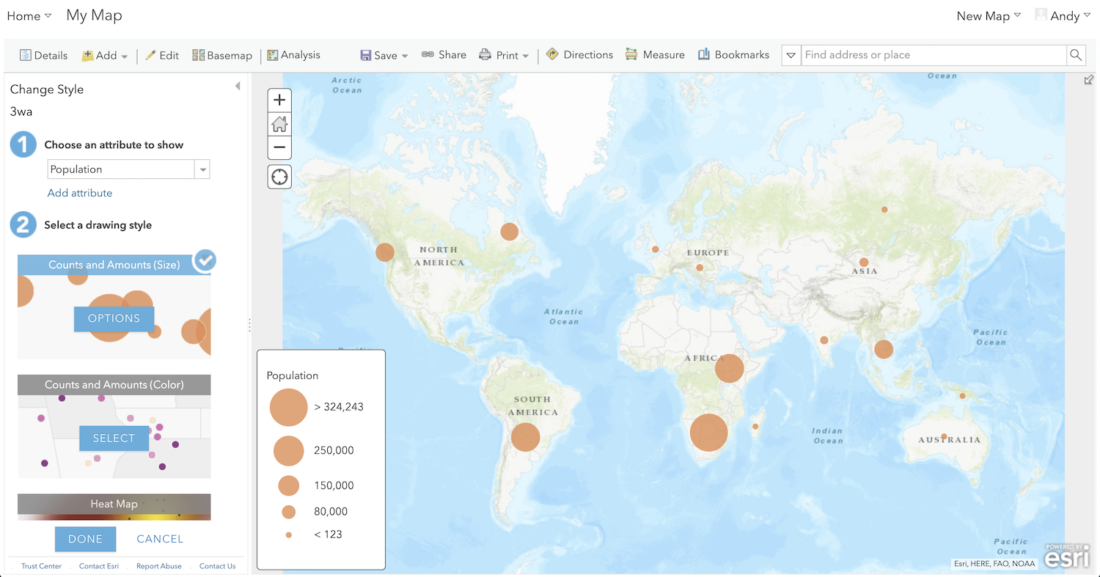
This then creates a new point layer on the map with one point for each 3 word address. All other fields of data in the CSV file are carried through to the layer. The next step is to configure attributes to show on popups and the symbols to use for each 3 word address point. In the example below, we use a population field to create scaled circles. Select “DONE” to apply the symbology:
After applying the style to the layer the layer appears in the Contents pane on the left-hand side and can then be used within spatial analysis or published for other users to access or within Web Mapping Applications.